|
The National Annenberg
Election Survey 2000
by Kate Kenski
In September, the Annenberg Public Policy Center (APPC) is releasing the
most comprehensive academic survey ever conducted on American political
attitudes and behavior. The 2000 National Annenberg Election Survey (NAES)
contains over 100,000 interviews with adults in the U.S. The data set is
included in the book Capturing Campaign Dynamics: The National Annenberg
Election Survey: Design, Method and Data, published by Oxford University
Press. Directed by Kathleen Hall Jamieson and Richard Johnston, the NAES
included measures of attitudes toward the presidential candidates and other
politicians, news media exposure and attention, voting intentions and
behavior, knowledge about candidate issue positions, and much more. In
addition to its large sample size, the NAES is distinctive because:
(1) of the time
period in which the survey was in the field,
(2) the survey was
conducted with a rolling cross-section (RCS) design, and
(3) the content of
the survey includes a comprehensive set of news media exposure, attention,
and political knowledge measures.
The 2000 rolling
cross-sectional survey, which began Nov. 8, 1999, and ended Jan. 19, 2001,
included daily telephone interviews with average samples of 50 to 300
people. Because the survey began in November of 1999, researchers can
analyze the dynamics of primary elections as never before. Moreover, the
survey stayed in the field for more than two months after Election Day,
during one of the more exciting periods in modern American political
history—the 36 days of uncertainty over who had won the presidency.
The unique RCS
design of the NAES allows political analysts to examine various dynamics
across the campaign. Households throughout the nation were randomly selected
using random-digit dialing. Unlike typical polls that release potential
telephone numbers into the field at one time, the NAES design called for a
release of a set number of "replicates" (random subsamples of the sampled
telephone numbers) for interviewing each night to ensure that each daily
cross-section was truly random.
The RCS procedures
stabilize the proportion of people that answers the survey on a given number
of call attempts in each daily cross-section. This allows researchers to
look at data over time with the assurance that respondents who answer the
survey at a given point in time look a lot like the respondents who answer
the survey at another point in time. Because the composition of each
cross-section is random, researchers can treat the date of interview as a
chance event. A detailed explanation of the design can be found in
Capturing Campaign Dynamics.
News Media
Consumption
Jamieson selected
the RCS design to permit analyses of the effects of campaign events and
media coverage. The RCS design combined with a comprehensive set of media
variables allows researchers to conduct such investigations.
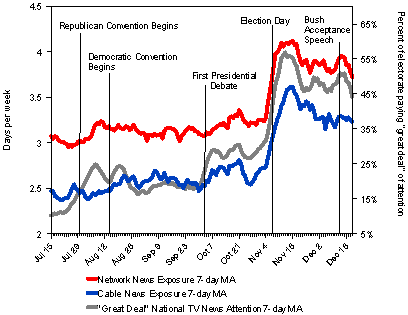
Graph 1 shows the
changes in news media consumption across the general election using
seven-day moving averages. Americans paid the most attention to national
television news during the 36-day dispute over the winner of the presidency.

Graph 1
Network and Cable News Exposure, and National
TV News Attention
Other findings
illustrate the power of the NAES design and content. The stability of party
identification has long been a concern to academics and pollsters alike.
Many academic models assume that party identification is a predictor of vote
choice. Some researchers, however, have suggested that self-reported party
identification is an attitude, which can be affected by the campaign, rather
than a stable predisposition. This question is important to those who
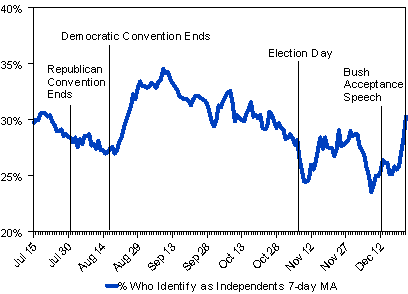
include party identification in the weighting of their data. Graph 2 reveals
the fluctuations in the percentage of survey respondents who refer to
themselves as independents. These changes appear systematic, rather than
random, suggesting that party identification is not stable across the course
of the general election.

Graph 2
Respondents Who Identify as Independents During
General Election
Early and Absentee
Voting
The NAES includes a
battery of early and absentee voting questions. What is unique about these
questions is that they were asked both before and after Election Day.
Election Day is thought to be the time when American citizens cast their
votes for the political leaders of their choice. The notion that American
voters cast their ballots on a single day, however, is no longer accurate.
Election Day is more accurately described as the last day when voting for
candidates takes place.
In many states,
citizens are given the opportunity to vote prior to Election Day by either
balloting by mail or voting early at polling stations. In 2000, 21 states
had no-fault absentee voting policies that allowed voting by absentee ballot
without giving a reason, such as work, illness, or religious holiday
conflict. Fourteen states provided early voting for their residents, which
allowed citizens to cast ballots for a period up to three weeks before the
general election at designated polling stations. Ten of these had both
no-fault absentee and early voting policies. Oregon held all-mail voting
elections in 2000; all registered voters received their ballots by mail.
Around 46% of respondents in the national rolling cross-section lived in the
26 liberal absentee, early voting, or voting-only-by-mail (VOBM) states.
The NAES
post-election survey shows that 15% of those who voted in the 2000 general
election cast their ballots before Election Day. In those states with
no-fault absentee balloting, early voting, and/or VOBM policies, 23.5% of
the voters cast their votes before Election Day.
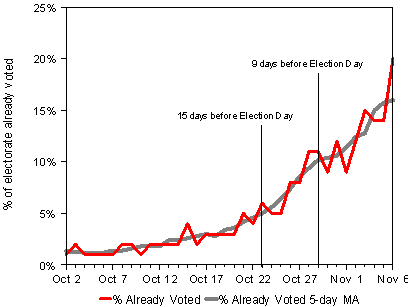
Graph 3 demonstrates
that campaign surveys that fail to acknowledge that voting often takes place
weeks before Election Day ignore an important campaign dynamic.

Graph 3
Percentage of Electorate That Voted Prior to Election
Day
Why should it matter
to campaigns that 15% of U.S. voters cast their ballots before Election Day?
If all absentee and early voting ballots were cast the day before the
election, then absentee and early voting would not greatly affect how
campaigns are conducted. If absentee and early voting take place over the
course of several weeks prior to Election Day, however, politicians would
have to adopt different types of campaign strategies to ensure that they get
their messages out before citizens have cast their ballots. The structure of
absentee and early voting during the pre-election period, therefore, becomes
important for political analysts to understand.
The five-day moving
averages in Graph 3 reveal that by October 23, 15 days before Election Day,
about 5% of the electorate had already voted. Nine days before Election Day,
on October 29, 10% of the electorate had cast ballots. By November 4, 15% of
the electorate had balloted.
In 2000, the NAES
post-election sample suggests those casting their ballots before Election
Day were 7.2% more likely to report having cast their ballots for Bush than
those who voted on Election Day. This suggests that pre-election analyses
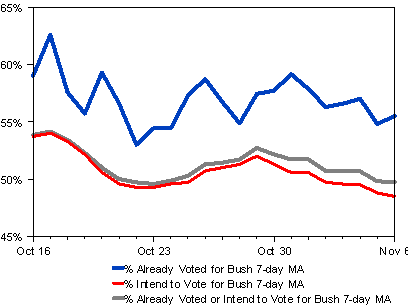
should take absentee and early voters into account. Graph 4 shows the
differences in the two-party vote preferences between those who intend to
vote but have not done so and those who have already cast their ballots. A
variable that combines responses to the voting intention question with those
from the choices made by the early voters shows the razor thin difference in
the vote preferences for Bush and Gore.

Graph 4
Percentage of Two-Party Vote Choice for Bush:
Intention to Vote and Early Ballot, Oct. 16 to Nov. 6
These examples are
just a few of the findings from this large data set. Reports of other NAES
2000 findings have been published in the book The Press Effect
(Jamieson and Waldman, 2003) and in articles and research notes in the
International Journal of Public Opinion Research (Kenski, Summer 2003),
Presidential Studies Quarterly (Waldman and Jamieson, March 2003),
and The Annals of the American Academy of Political and Social Science
(Nov. 2000). Because of the NAES’ depth and breadth, APPC researchers have
only scratched the surface in analyzing the data.
The NAES 2004 team
includes a distinguished group of analysts, pollsters and researchers. This
team will be led by Kathleen Hall Jamieson, Director of the Annenberg Public
Policy Center. To ensure that campaign events are appropriately reflected in
the survey, Adam Clymer, former Chief Washington Correspondent of The New
York Times, has joined the Washington office of the Annenberg Public
Policy Center of the University of Pennsylvania as Washington Director.
Based at the APPC’s offices in Philadelphia, Ken Winneg, former Vice
President for Penn, Schoen and Berland, will serve as the Managing Director
of the Survey.
Daily interviews for
the 2004 survey begin on Nov. 1, 2003, and will continue through the
presidential inauguration in 2005. Regular reports will be released by the
Annenberg Public Policy Center (www.appcpenn.org/naes). |
|